
💥 Why Is My Power BI Report So Slow? The Hidden Culprit You’re Probably Ignoring

If your Power BI dashboard takes longer to load than your coffee takes to brew, you’re not alone. Slow performance is one of the most frustrating issues analysts face — especially when you’ve already optimized visuals, minimized data volume, and reduced slicers.
But what if the real problem isn’t visible on the surface?
🚦The Usual Suspects: And Why They’re Not Enough
Most performance advice boils down to:
- Avoid too many visuals on one page.
- Don’t load too much data.
- Use aggregations or DirectQuery wisely.
These are good practices — but often, even after doing all this, performance issues persist. That’s when you need to look deeper.
Let’s uncover one of the most misunderstood villains behind sluggish Power BI performance.
1. Context Transition: The Silent Killer
In Power BI, DAX measures often rely on context transitions — converting row context (like when iterating) into filter context. It’s a foundational concept, but also a silent performance killer if misunderstood.
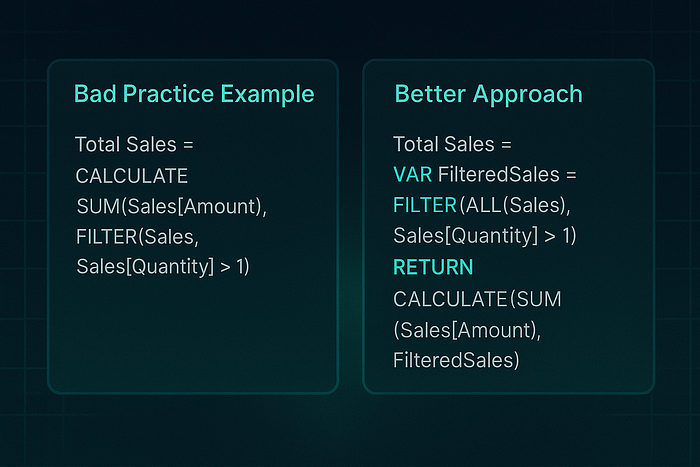
🔥 Bad Practice Example:
Total Sales = CALCULATE( SUM(Sales[Amount]), FILTER(Sales, Sales[Quantity] > 1))
What’s wrong here? The FILTER(Sales, ...) iterates over the entire Sales table, even if you're filtering by product or region in a visual. That means your measure is recalculating way more than it needs to — every single time.
✅ Better Approach:
Total Sales = VAR FilteredSales = FILTER(ALL(Sales), Sales[Quantity] > 1)RETURN CALCULATE(SUM(Sales[Amount]), FilteredSales)
Still not perfect, but already more efficient by reducing row context dependence.
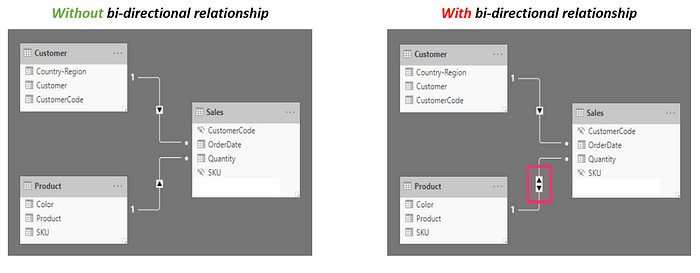
2. The Relationship Trap: Bi-Directional Backfire
It’s easy to click “Both” when setting up a relationship direction — after all, it makes things work, right?
That’s the trap.
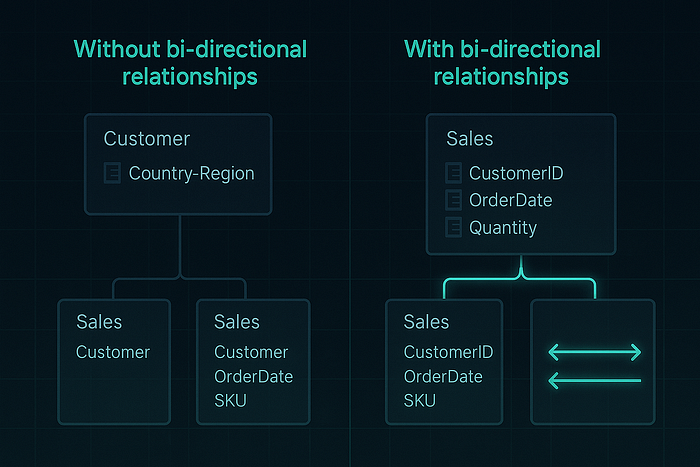
Bi-directional relationships can balloon your query plans and confuse filter propagation, especially in complex data models. Let’s visualize this:
Imagine a star schema. Sales is in the center, connected to Date, Products, and Customers. If all relationships are set to “Both”, Power BI starts evaluating filters in every direction — drastically increasing compute time.
Want to know the actual issue? Use Performance Analyzer!
Power BI’s built-in Performance Analyzer is a lifesaver.
Try this:
- Open your report.
- Go to View > Performance Analyzer.
- Start recording and refresh a few visuals.
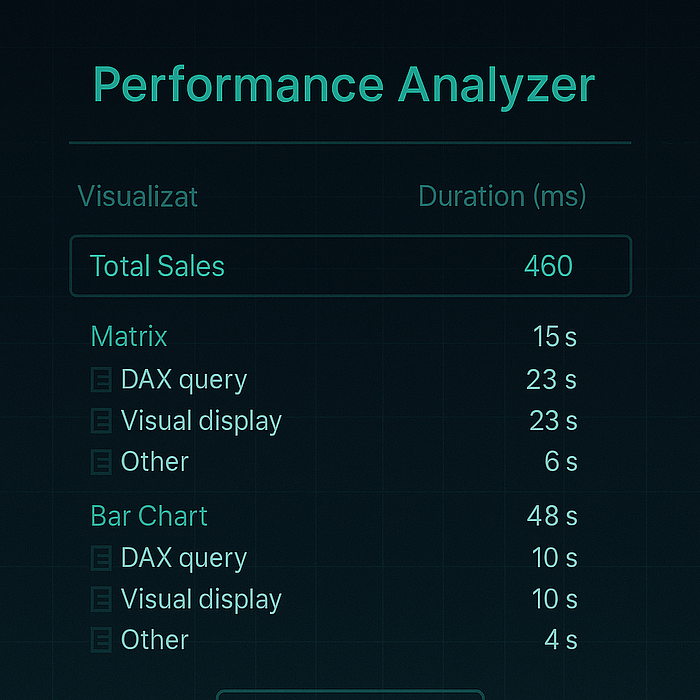
You’ll see which visuals and measures are consuming the most milliseconds. Often, the culprits are those with misused CALCULATE, FILTER, or heavy relationship logic.
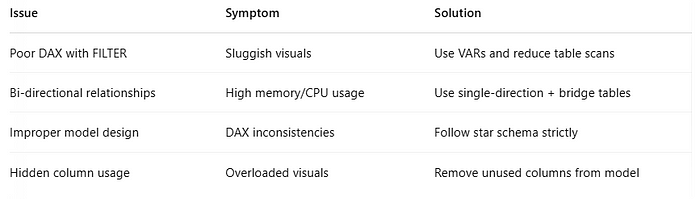
💡 Key Fixes and Takeaways
✨ Wrap-Up: It’s Not Always What You See
If your Power BI report feels like it’s crawling, the issue may not be what’s on the canvas — it might be lurking behind the scenes in your DAX or data model. Tuning these elements can give your dashboard the speed boost it deserves.
📚 Further Reading
To deepen your understanding of the topics discussed, consider exploring the following resources:
- Understanding Context Transition in DAX — SQLBI
- Bi-directional Relationship Guidance — Microsoft Learn
- DAX Cheat Sheet for Beginners — Pragmatic Works
- Power BI Cheat Sheet — Dataquest
{{cheat-sheet-3}}
.avif)

.avif)